



It is a scene that is surely recreated in clubhouses across the land – particularly since the dawn of the World Handicap System.
A big score is revealed and everyone looks at each other and blurts out, ‘what were the odds of that happening?’ They’re probably saying quite a few other things too, but, thanks to the USGA, we can now look at the frequency and probability of players shooting certain scores based on their handicaps.
That’s right, the governing body has produced a table on the odds of particular scores relative to various handicap indexes.
They’ve done it by measuring against the net score differential. That is defined as the score differential minus the player’s handicap index.
So study the below figures carefully. It’s a lot of numbers but they reveal some fascinating things about the odds of beating your golf handicap, as well as about the nature of competitions and who wins them.
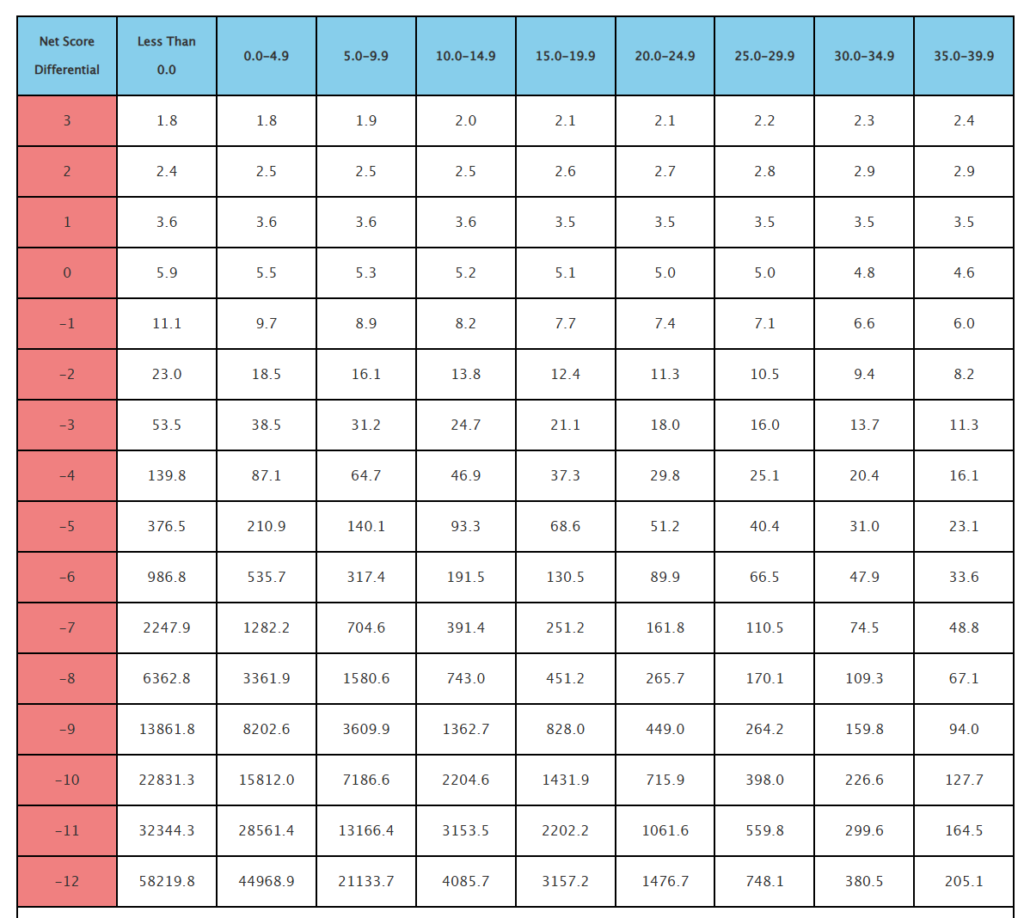
What are the odds of beating your golf handicap?
We’ve said this a few times at NCG – it’s a fairly obvious point, no one is suggesting we’re Einstein here – but these figures are statistical proof of it. The higher your handicap, the more room you have got to improve and the better the chance you might play under your handicap.
Let’s look at the odds of a player with a handicap index of 25 to 29 shooting a net score differential of four under. It’s one in 25.1 (It gets as low as 16.1 for players in the 35 to 39 range). So, mathematically, they will achieve this feat in roughly one in every 25 rounds.
Now let’s compare that against a player with a range of 0.0 to 4.9. Their probability of shooting the same net score differential is 1 in 87.1.
So if my maths are right (and it was never my strongpoint) we can say the higher player has roughly a 3.5 times better chance of posting that net score than a lower player in any one round.
Advertisement
Let’s take a completely absurd figure and look again. A golfer with a differential of 35 to 39 has a roughly 1 in 205 chance of posting a net score differential of -12. For the scratch and old Category 1 players, that same probability comes in at 1 in 44,968.9.
What’s the most likely net score differential we will post?
Before we get into any analysis of what all this might mean, we can also look at the numbers another way and ask what is the most likely net score differential we will post by handicap range.
The answer is surprisingly uniform – at least as far as the numbers allow us to go. It’s a net score differential of 3. That might surprise some of you who think scratch and plus players are ordained with a god given ability to shoot under par in all circumstances.
And for everyone who thinks a high handicapper only has to turn up to beat their handicap – because they’ve got so many shots in the bank – the chances of a 35 to 39 player posting a minus number is actually about 1 in 6.

What do these figures mean?
Shall we try and put these figures into context? Let’s look at a golfer with a 25 index. The chances of them posting a net score differential of -7 is around 1 in 110.5 rounds.
Let’s do the same for a 4-index, which is a probability of 1 in 1,282.2 rounds.
If we assume each golfer plays once a week, the 25-index player will achieve this feat roughly once every two years. Care to guess the 4-index? It’s a truly generational occurrence – happening around once every 24 years.
Can we look at this another way? Using artificial intelligence, we can calculate how many players in each band would be required in a field of 100 golfers if the winning score was a round with a net differential of -4.
This ensures each band (not individual players) has the same statistical chance of producing a winner.
The results are fascinating. For example, it would require 30 scratch to plus golfers to have the same odds as just 3 players with a 35-39.9 index.
What can we take from these figures?
These USGA numbers were produced to help handicap committees during their reviews of players but there are other conclusions we can take from them. We know the average male handicap in England is 17.1 and female is 27.2. In the USA, it’s 14.2 and 28.7.
Just under three quarters of men in England are in the 13 to 28 handicap range (45% 13 to 20 and just over 30% from 21 to 28). Male players with handicaps of five or less account for less than five per cent of the country’s golfing population.
Again, we’ve said this before but if you’ve got a body of players who trend towards the higher handicaps, and the odds of them shooting certain low net differentials are much better than for their ‘more talented’ colleagues then they are going to dominate the competitions they enter.
That’s nothing to do with the handicap system, it’s weight of numbers. But it could give clubs food for thought when considering the make-up of their competition schedule.
Playing handicaps and allowances are designed to create equity and reduce the chances of players who can shoot lower scores sweeping leaderboards, says the USGA in notes to this table.
But even taking into account 95%, or whatever the number, these probabilities suggest there are categories of players who are always going to be up against it.
Committees concerned about this would need to be creative. Stablefords are fun, but do they dominate a calendar? If they do, could clubs consider mixing more medals into the schedule?
Advertisement
Divisions and lowest gross categories can be an easy way of spreading prize money about. Why not introduce them into trophy and board competitions? The number of members who tell me their clubs don’t do this is mind-boggling. There is nothing in competition rules to stop clubs doing this – they are largely the masters of their own terms of competition.
As long as you’ve got an overall trophy winner – the name that goes up on the wall – what does it matter how the rest of the prizes are shared as long as it’s fair and equitable?
If clubs have got lots of members moaning – particularly low handicappers – and they are not looking at ways to equalise some of these numbers then they’ve probably only got themselves to blame.
Now have your say on the odds of beating your golf handicap
What are the odds of beating your golf handicap? What do you think about these figures? What do you think they say about the various score differentials? Have you ever had a round that defied probability? Let us know by leaving a comment, or get in touch on X.
Advertisement