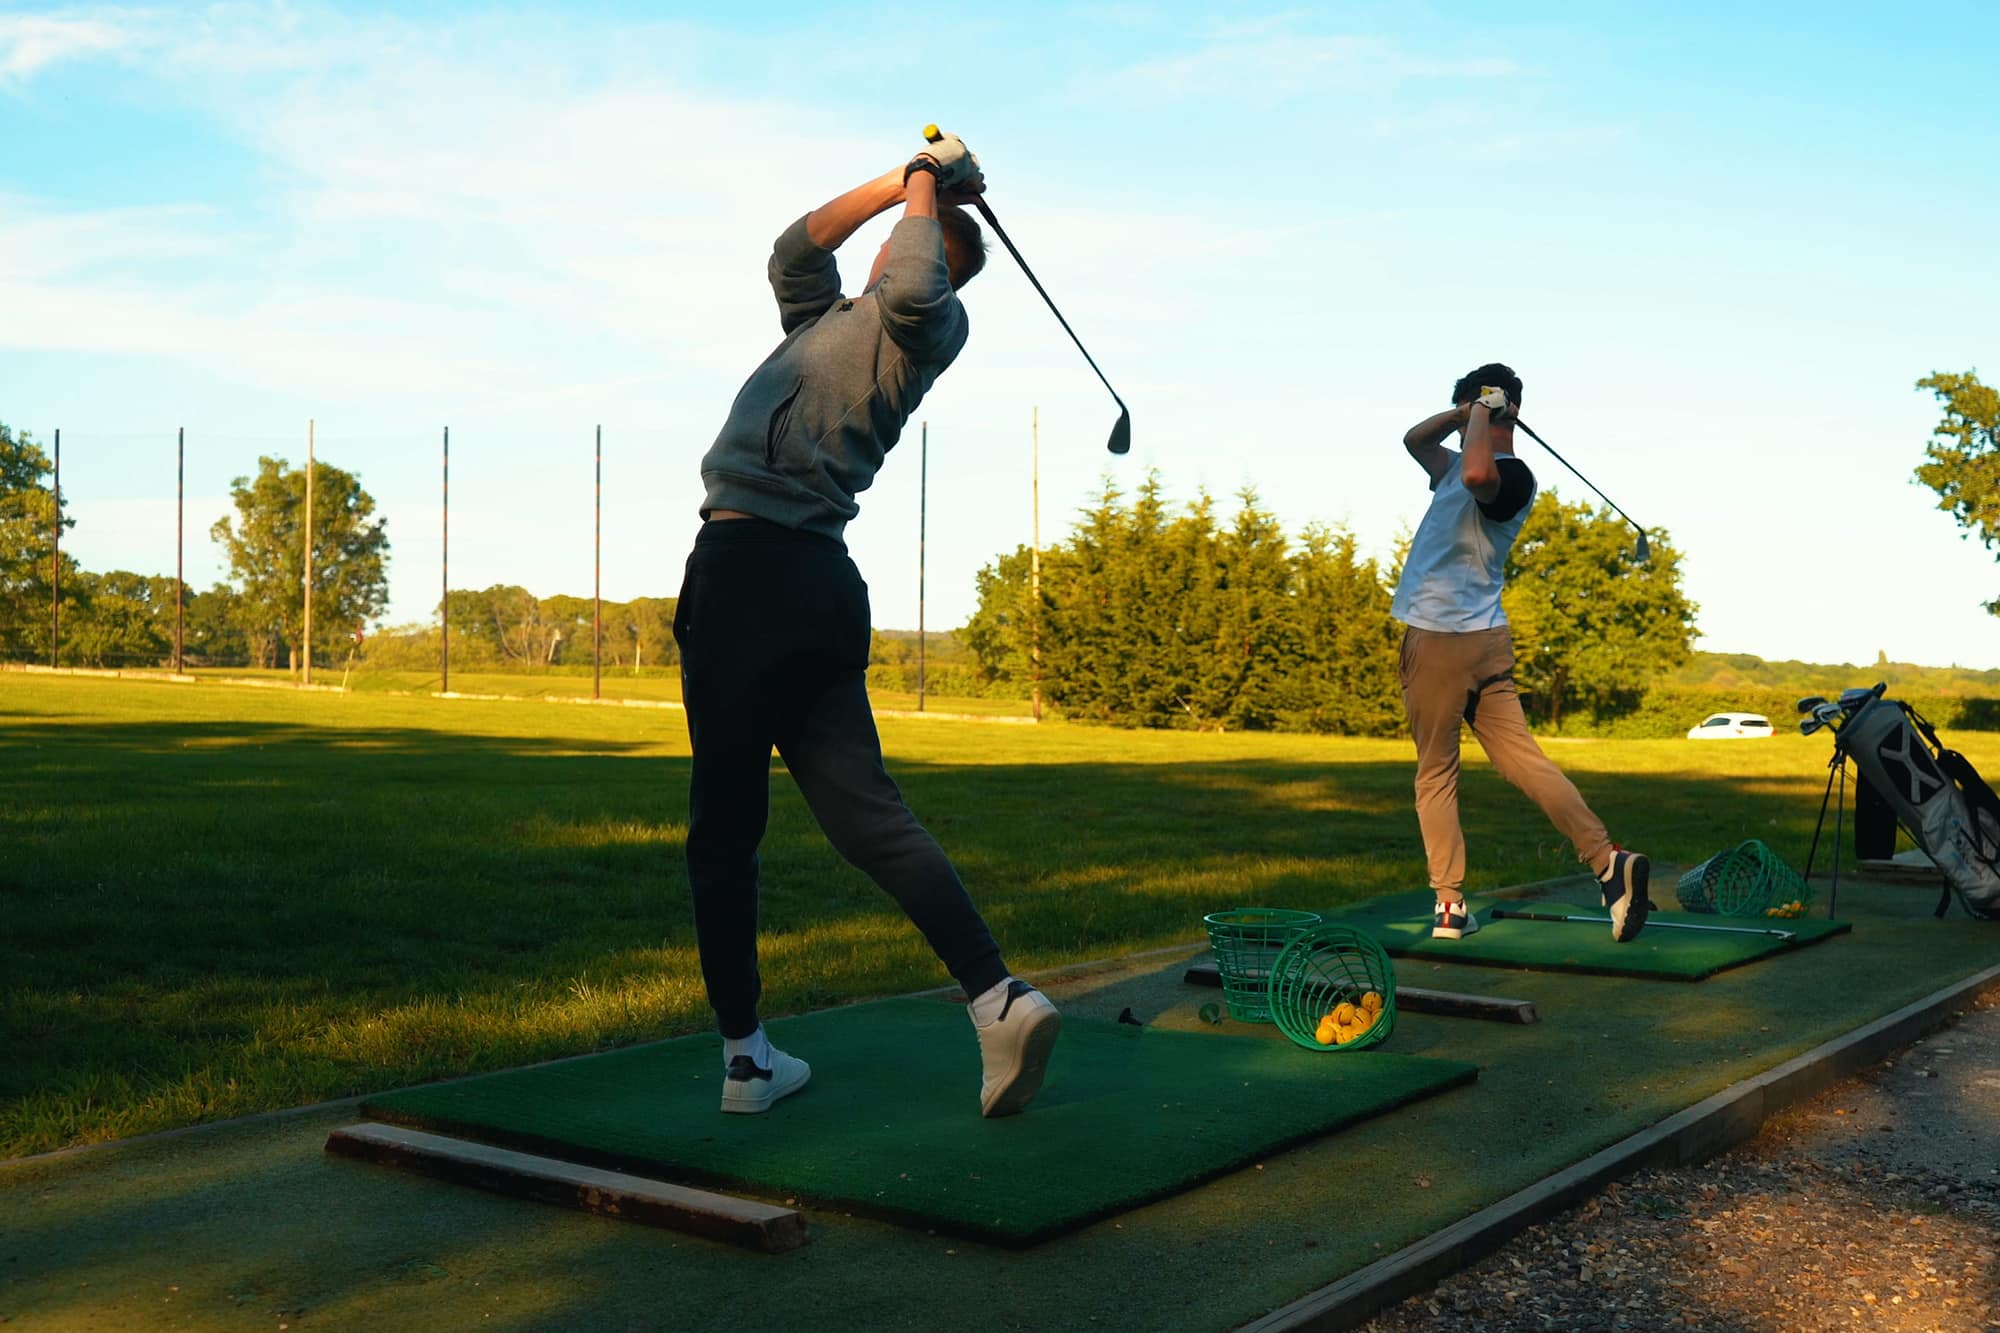
If you’ve ever wondered what golf really looks like in England, these figures reveal all.
England Golf have published their latest state of the nation stats on golf in the country from their 1,735 clubs and they make fascinating reading.
We know that golf club membership remains relatively healthy. There are around 730,000 in the country, up around 8,000 on 2023 and 10,000 on 2022.
iGolf subscribers number more than 55,000, and account for around seven per cent of golfers with a World Handicap System index.
But digging below the surface, lots of other interesting data emerges – including some numbers on where the best golfers – and by that we mean the lowest average handicaps – play.
So if you want to see how your clubhouse stacks up against the rest of his sceptred isle then read on…

What’s the average golf handicap in England?
For golf club members, it is 18.62. The average male has an index of 17.38 with females playing to 28.09. That’s slightly up on the last time these numbers were measured, when it was 17.1 and 27.2 respectively.
The figures are a little higher when you look at iGolfers. These subscribers average at 20.07 (19.72 for males and 30.88 for females).
Which county has the lowest average handicappers in England?
Right, bragging rights are at stake. The county which is top of the tree when it comes to the lowest average handicap index of golfers is…
Isle of Man.
That’s not even in England, I hear you cry! But it is part of England’s Golf North Region and, while the Crown Dependency may only have eight courses, it must have some talented players.
Not only does it have the lowest handicap average by golf club member, at 16.84, but its iGolfers can also play too (16.45). The overall average of 16.65 is more than a shot and a half ahead of runners-up Surrey on 18.25. Kent squeak into third with an average handicap if 18.41.
Yorkshire are in the bottom half of this table of club members – 21st of England’s 34 golfing counties with an average handicap of 19.59. Lancashire shouldn’t celebrate too hard, though. They are firmly mid-table at 19.34.
Advertisement
Who is bringing up the rear? We’re sorry to do this but the English county with the highest average handicap index is Cambridgeshire at 20.93. They just get the wooden spoon ahead of Suffolk (20.66) and Cornwall (20.56).
Average Handicap Index of golfers by English county
| 1 | Isle of Man | 16.65 |
| 2 | Surrey | 18.25 |
| 3 | Kent | 18.41 |
| 4 | Cumbria | 18.64 |
| 5 | Nottinghamshire | 18.67 |
| 6 | Durham | 18.79 |
| 7 | Hertfordshire | 18.80 |
| 8 | Essex | 18.80 |
| 9 | Northumberland | 18.82 |
| 10 | Leicestershire & Rutland | 18.94 |
| 11 | Middlesex & London | 19.02 |
| 12 | Cheshire | 19.04 |
| 13 | Warwickshire | 19.06 |
| 14 | Bedfordshire | 19.28 |
| 15 | Berks, Bucks & Oxon | 19.29 |
| 16 | Northamptonshire | 19.29 |
| 17 | Lancashire | 19.34 |
| 18 | Gloucestershire | 19.39 |
| 19 | Derbyshire | 19.54 |
| 20 | Wiltshire | 19.55 |
| 21 | Yorkshire | 19.59 |
| 22 | Sussex | 19.63 |
| 23 | Shropshire & Herefordshire | 19.81 |
| 24 | Dorset | 19.92 |
| 25 | Staffordshire | 20.14 |
| 26 | Somerset | 20.18 |
| 27 | Lincolnshire | 20.23 |
| 28 | Norfolk | 20.30 |
| 29 | Hampshire, Isle of Wight & Channel Islands | 20.31 |
| 30 | Devon | 20.50 |
| 31 | Worcestershire | 20.52 |
| 32 | Cornwall | 20.56 |
| 33 | Suffolk | 20.66 |
| 34 | Cambridgeshire | 20.93 |
Now have your say
What do you think of these figures? Do they stack up with your experience? Do they tally with your views on the average golf handicap in England? What do you think about the membership numbers overall? Let us know by leaving a comment on X.